Problem
The challenge with unstructured data at scale.
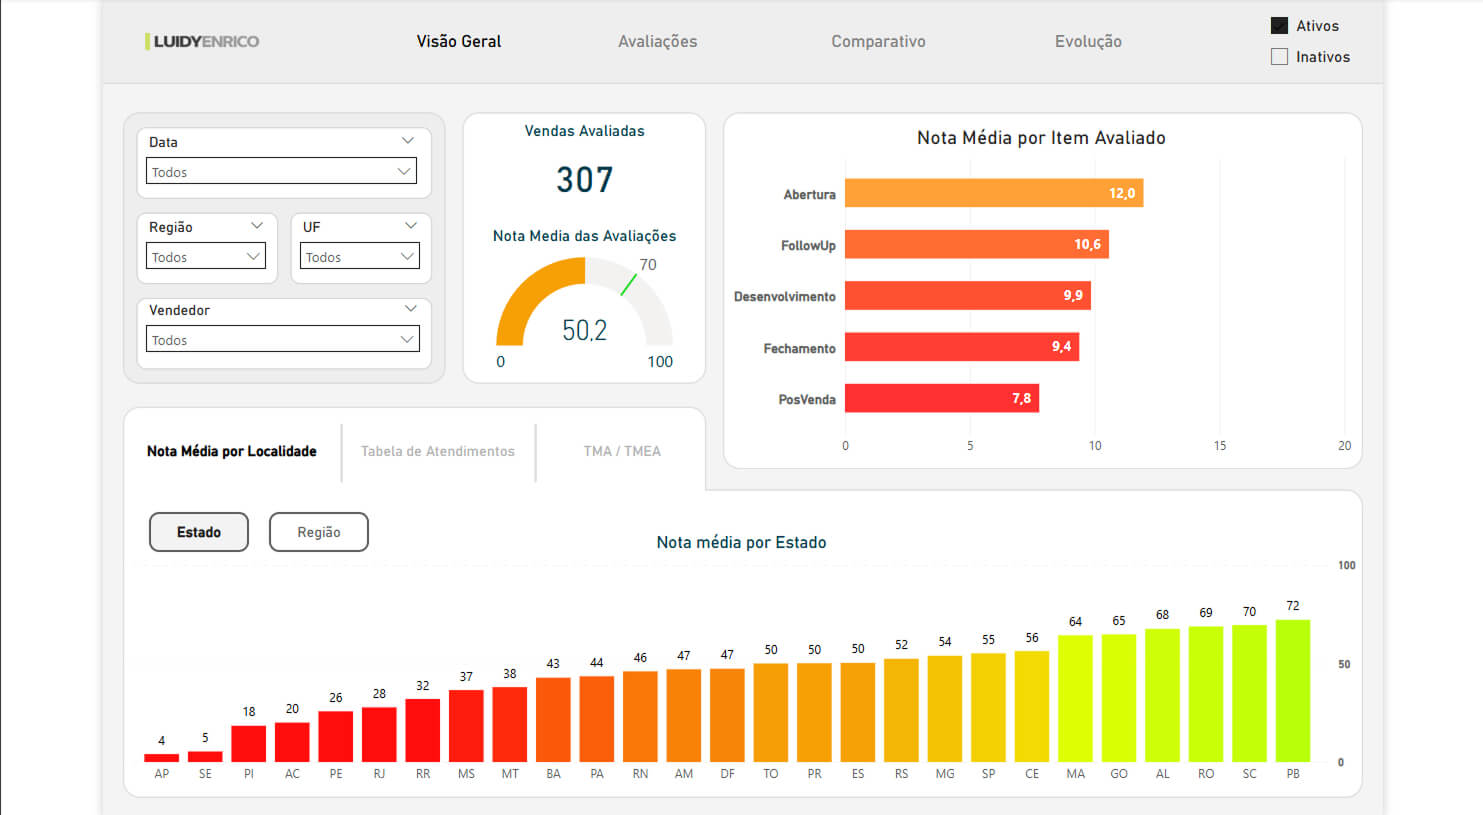
The marketing and acquisition team manually evaluated sales calls and interactions, assigning scores for each stage. However, this data was scattered across spreadsheets and lacked any analytical structure. Managers had no clear view of who needed support, which regions were underperforming, or how scores were evolving over time.
Solution
An intelligent, automated extraction pipeline.
I developed an analytical dashboard in Power BI that integrated several data sources. I used SQL to extract dimensions from the internal database and Dataverse, and built Python scripts to process and clean complex tables before importing. Using DAX, I modeled key performance indicators to allow detailed analysis by agent, region, and service stage.
- Data integration from SQL and Dataverse
- Pre-processing of complex data with Python
- Advanced DAX modeling for performance KPIs
Tech Stack
Results
+40%
Sales Increase
100%
Traceability
1:1
Targeted Support
The dashboard implementation led to a significant performance improvement for the sales team. Evaluators used the tool to identify top and bottom performers, enabling them to provide necessary support and conduct 1:1 meetings. This data-driven strategy resulted in a 40% increase in overall sales.